Unlocking Insights: How to Track Metrics with Business Intelligence Software Tools
In today’s data-driven world, businesses are constantly seeking ways to gain a competitive edge. The ability to understand and interpret data is no longer a luxury, but a necessity. One of the most effective ways to achieve this is by leveraging business intelligence (BI) software tools. These tools empower organizations to track metrics, analyze performance, and make informed decisions. This article delves into the core of how to track metrics with business intelligence software tools, providing a comprehensive guide to its implementation and benefits.
The Power of Data: Why Tracking Metrics Matters
Before exploring the ‘how,’ it’s crucial to understand the ‘why.’ Why is tracking metrics so important? The answer lies in the ability to transform raw data into actionable insights. Tracking metrics allows businesses to:
- Monitor Performance: Identify key performance indicators (KPIs) and track their progress over time.
- Identify Trends: Spot patterns and trends that can inform future strategies.
- Make Data-Driven Decisions: Base decisions on factual evidence rather than intuition.
- Improve Efficiency: Optimize processes and resource allocation.
- Enhance Customer Experience: Understand customer behavior and preferences.
Without effective metric tracking, businesses operate in the dark, making it difficult to understand what’s working and what’s not. Business intelligence software tools provide the clarity needed to thrive.
Choosing the Right Business Intelligence Software Tool
The market offers a plethora of business intelligence software tools, each with its own strengths and weaknesses. Selecting the right tool is crucial. The decision should be based on several factors:
- Business Needs: What specific data and insights are required?
- Data Sources: Where is the data stored (e.g., databases, spreadsheets, cloud services)?
- Budget: How much can be invested in the software?
- Technical Skills: What level of technical expertise is available within the organization?
- Scalability: Can the tool handle future growth and data volume?
Some popular business intelligence software tools include:
- Tableau: Known for its user-friendly interface and powerful data visualization capabilities.
- Microsoft Power BI: A versatile tool that integrates seamlessly with Microsoft products.
- Qlik Sense: Offers associative data modeling for in-depth analysis.
- Looker: A cloud-based platform focused on data governance and collaboration.
- Sisense: Designed for complex data analysis and embedded analytics.
Each tool has its own pricing structure, features, and learning curve. Conducting thorough research and comparing different options is essential before making a commitment.
Setting Up Your Business Intelligence Software: A Step-by-Step Guide
Once a tool is selected, the next step is implementation. Here’s a general guide on how to track metrics with business intelligence software tools:
- Define Your KPIs: Determine the specific metrics that will be tracked. Examples include revenue, customer acquisition cost, website traffic, and conversion rates.
- Connect to Data Sources: Establish connections to all relevant data sources. This may involve connecting to databases, cloud storage, or other platforms.
- Clean and Prepare Data: Clean and transform the data to ensure accuracy and consistency. This may involve removing duplicates, correcting errors, and formatting data.
- Create Data Models: Build data models to organize and structure the data for analysis. This often involves defining relationships between different data sets.
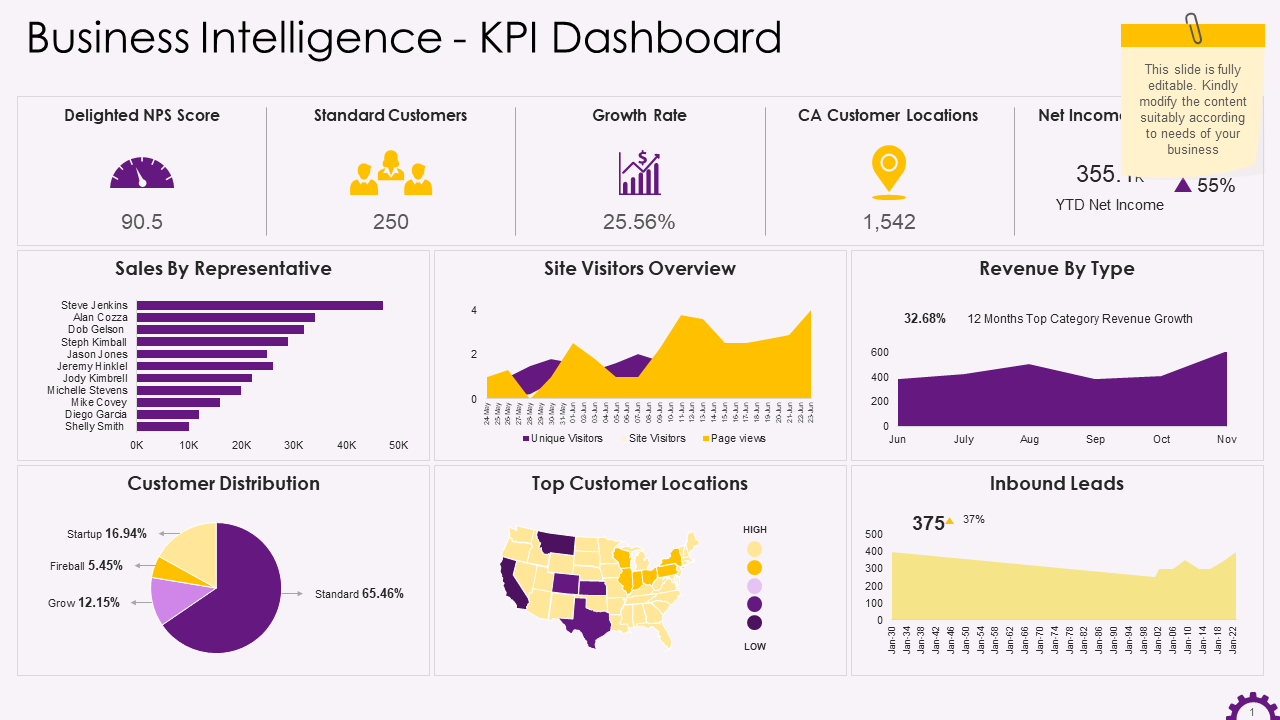
- Build Dashboards and Reports: Design dashboards and reports to visualize the data and track metrics. Choose appropriate charts and graphs to effectively communicate insights.
- Set Up Alerts and Notifications: Configure alerts and notifications to be informed of significant changes in the data.
- Test and Validate: Thoroughly test the reports and dashboards to ensure accuracy and reliability.
- Train Users: Provide training to users on how to interpret the data and use the software effectively.
- Monitor and Refine: Continuously monitor the performance of the dashboards and reports, and make adjustments as needed.
Key Metrics to Track for Business Success
The specific metrics to track will vary depending on the business and its objectives. However, some common categories and examples of KPIs include:
- Sales and Revenue: Revenue, profit margin, sales growth, customer lifetime value.
- Marketing: Website traffic, conversion rates, cost per acquisition, return on investment (ROI) of marketing campaigns.
- Customer Service: Customer satisfaction scores, resolution time, number of support tickets.
- Operations: Production efficiency, inventory turnover, order fulfillment rates.
- Finance: Cash flow, expenses, return on assets.
By focusing on these key areas and tailoring the metrics to specific business goals, organizations can gain a deeper understanding of their performance and identify areas for improvement. Selecting the right metrics is a critical component of understanding how to track metrics with business intelligence software tools.
Data Visualization: Making Sense of the Numbers
Business intelligence software tools excel at data visualization. This ability to present data in a clear and understandable format is crucial for effective metric tracking. Effective data visualization allows users to quickly identify trends, patterns, and anomalies that might be missed in raw data. Common visualization techniques include:
- Charts: Bar charts, line charts, pie charts, and scatter plots are all useful for visualizing different types of data.
- Dashboards: Interactive dashboards that allow users to explore data and customize views.
- Geographic Maps: Maps that display data geographically, highlighting regional trends.
- Heatmaps: Heatmaps that use color to represent the intensity of data values.
The choice of visualization technique should be based on the type of data being presented and the insights that need to be communicated. A well-designed visualization can transform complex data into easily digestible information, making metric tracking more effective.
Best Practices for Effective Metric Tracking
To maximize the value of business intelligence software tools, it’s important to follow best practices:
- Start Small: Begin with a limited set of key metrics and gradually expand as needed.
- Focus on Actionable Insights: Choose metrics that can inform decisions and drive action.
- Ensure Data Accuracy: Regularly validate data to ensure its reliability.
- Automate Data Collection: Automate data collection and reporting to save time and reduce errors.
- Provide Training: Train users on how to interpret data and use the software effectively.
- Regularly Review and Refine: Regularly review the metrics being tracked and make adjustments as needed.
- Establish Data Governance: Implement data governance policies to ensure data quality and security.
- Promote Data Literacy: Foster a data-driven culture throughout the organization.
By adhering to these best practices, businesses can ensure they are getting the most out of their business intelligence software tools.
The Future of Metric Tracking and Business Intelligence
The field of business intelligence is constantly evolving. Trends like artificial intelligence (AI) and machine learning (ML) are playing an increasingly significant role. AI and ML are being used to automate data analysis, identify hidden patterns, and predict future trends. This will further enhance the ability to track metrics and make data-driven decisions. The future of business intelligence promises even more powerful tools and capabilities, making it crucial for businesses to stay informed and adapt to these changes. Businesses that embrace these advancements will be best positioned to succeed in the future.
Business intelligence software tools are essential for modern businesses. They offer a powerful way to track metrics, analyze performance, and make data-driven decisions. By understanding the principles of metric tracking, choosing the right software, and following best practices, organizations can unlock valuable insights and gain a competitive advantage. The ability to leverage data effectively is no longer optional; it’s a key driver of success.
[See also: The Role of Data Analytics in Business Growth]
[See also: How to Choose the Right BI Tool for Your Business]
[See also: Data Visualization Best Practices]

